
The waves
The J point and ST segment
Measuring elevation and depression
The ST segment is the plateau when all the ventricular muscle is depolarized. It should sit level with the baseline. Elevation or depression is measured at the J point, where the QRS ends.
Last updated
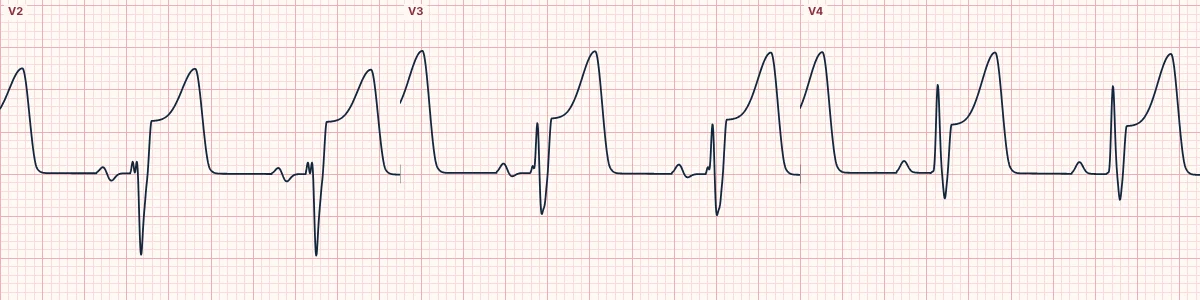
Example tracing, drawn by the lab's engine. Open the lab for a live, adjustable version.
At a glance
- Measured at
- J point
- Reference
- TP segment (or PR)
- Significant
- ≥ 1 mm in most leads
- V2–V3
- Higher thresholds (see STEMI criteria)
Figures
Still images drawn by the lab's engine at 25 mm/s and 10 mm/mV, with the finding labeled. Select a figure to enlarge it.
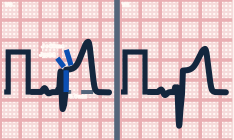
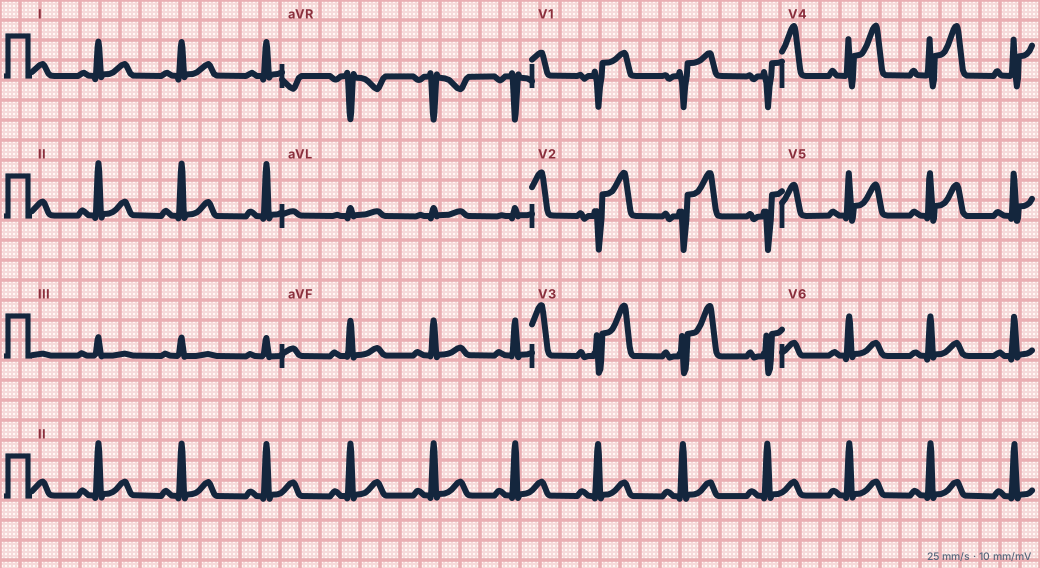
Scroll sideways to see the whole tracing, or select it to enlarge.
Where to measure
Find the J point, the junction between the end of the QRS and the start of the ST segment. Compare its height with the baseline, best taken from the TP segment (or the PR segment when the TP is hidden at fast rates).
Shape matters
Concave (smiling) elevation is typical of early repolarization and pericarditis. Straight or convex (frowning) elevation, especially with reciprocal depression, is typical of acute coronary occlusion. Horizontal or downsloping depression suggests ischemia; upsloping depression is less specific.
Why it moves
Injured muscle cannot hold a normal resting voltage, so a current of injury flows between injured and healthy tissue. On the ECG this shifts the ST segment toward the injured area (elevation in leads facing it, depression in leads opposite).
How to read it
- Pause the live tracing and compare the J point with the baseline in each lead.
- The ST panel in the lab reports ST deviation at the J point and 60 ms later for every lead.
- Look for reciprocal change before deciding.
Pitfalls
- A wide QRS (bundle branch block, pacing, LVH) shifts the ST segment as a secondary change.
- Baseline wander makes the ST look shifted; use several beats.
Key numbers
- Measured at
- J point
- Reference
- TP segment (or PR)
- Significant
- ≥ 1 mm in most leads
- V2–V3
- Higher thresholds (see STEMI criteria)
Advanced Down to the ion channel
What the cells are doing
Pacemaker, atrial and ventricular action potentials, in step with the tracing above, with sodium, calcium and potassium moving through their channels.
Frequently asked questions
The J point and ST segment: what is the key idea?
The ST segment is the plateau when all the ventricular muscle is depolarized. It should sit level with the baseline. Elevation or depression is measured at the J point, where the QRS ends.
The J point and ST segment: what are the key numbers?
Measured at: J point; Reference: TP segment (or PR); Significant: ≥ 1 mm in most leads; V2–V3: Higher thresholds (see STEMI criteria).
The J point and ST segment: how do you apply it to an ECG?
Pause the live tracing and compare the J point with the baseline in each lead. The ST panel in the lab reports ST deviation at the J point and 60 ms later for every lead. Look for reciprocal change before deciding.
The J point and ST segment: what are the common pitfalls?
A wide QRS (bundle branch block, pacing, LVH) shifts the ST segment as a secondary change. Baseline wander makes the ST look shifted; use several beats.
Sources
This page does not list page-specific sources yet.
Every source the site cites, with links