
The waves
The T wave
Ventricular repolarization
The T wave records the ventricles recovering. It normally points the same way as the QRS because repolarization runs in the opposite direction to depolarization.
Last updated
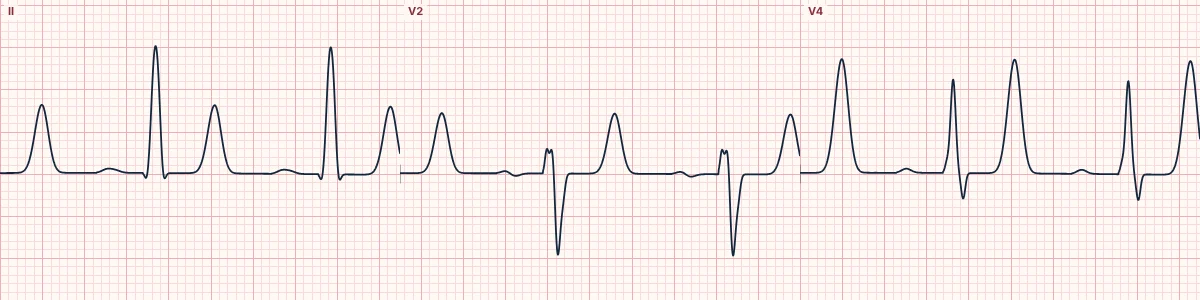
Example tracing, drawn by the lab's engine. Open the lab for a live, adjustable version.
At a glance
- Upright
- I, II, V3–V6
- Inverted
- aVR
- Variable
- III, aVL, aVF, V1
- Follows
- The main QRS direction
Figures
Still images drawn by the lab's engine at 25 mm/s and 10 mm/mV, with the finding labeled. Select a figure to enlarge it.
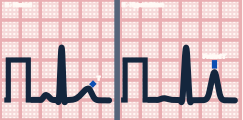
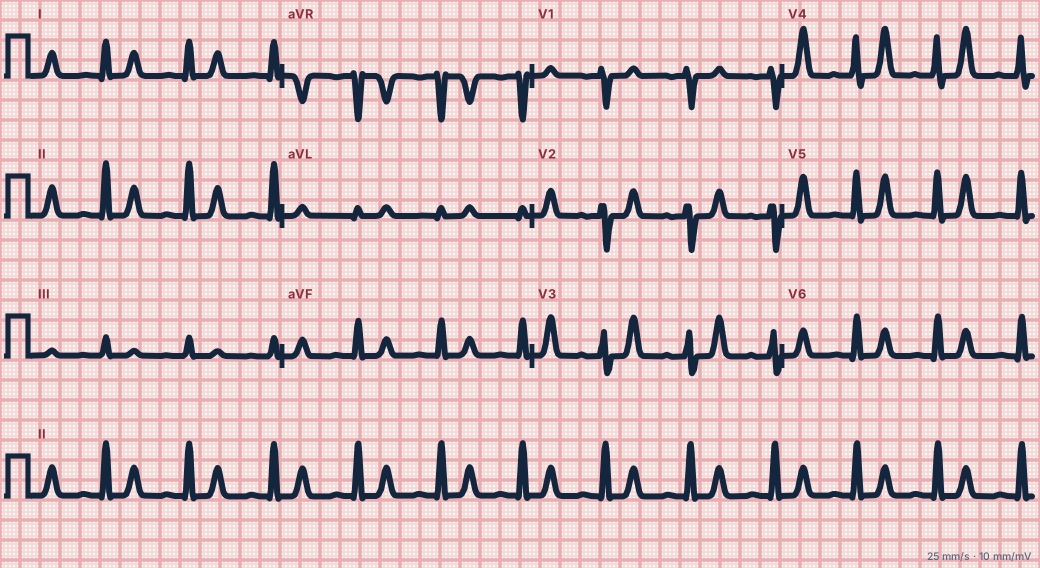
Scroll sideways to see the whole tracing, or select it to enlarge.
Why it is upright
The epicardium repolarizes before the endocardium, the reverse of the order in which they depolarized. A wave of recovery moving away from an electrode writes the same deflection as a wave of activation moving toward it, so the T wave follows the QRS.
Normal T waves
Upright in I, II and V3–V6 and inverted in aVR. Normally inverted or flat in V1 and sometimes in III; persistent juvenile T-wave inversion in V1–V3 is a normal variant in children and some adults.
Abnormal T waves
Tall, narrow and peaked suggests hyperkalemia. Tall and broad (hyperacute) in the early minutes of coronary occlusion. Deep symmetric inversion can follow ischemia (Wellens), pulmonary embolism or raised intracranial pressure. Flattening with a prominent U wave suggests hypokalemia.
How to read it
- Check that each T wave points the same way as its QRS.
- Compare T-wave height with the QRS; a T taller than the R in several leads deserves explanation.
- Look for new inversion compared with an old ECG.
Pitfalls
- In bundle branch block and ventricular rhythms the T wave normally points opposite the QRS (secondary change).
Key numbers
- Upright
- I, II, V3–V6
- Inverted
- aVR
- Variable
- III, aVL, aVF, V1
- Follows
- The main QRS direction
Advanced Down to the ion channel
What the cells are doing
Pacemaker, atrial and ventricular action potentials, in step with the tracing above, with sodium, calcium and potassium moving through their channels.
Frequently asked questions
The T wave: what is the key idea?
The T wave records the ventricles recovering. It normally points the same way as the QRS because repolarization runs in the opposite direction to depolarization.
The T wave: what are the key numbers?
Upright: I, II, V3–V6; Inverted: aVR; Variable: III, aVL, aVF, V1; Follows: The main QRS direction.
The T wave: how do you apply it to an ECG?
Check that each T wave points the same way as its QRS. Compare T-wave height with the QRS; a T taller than the R in several leads deserves explanation. Look for new inversion compared with an old ECG.
The T wave: what are the common pitfalls?
In bundle branch block and ventricular rhythms the T wave normally points opposite the QRS (secondary change).
Sources
This page does not list page-specific sources yet.
Every source the site cites, with links