
Occlusion MI and ischemia signs
Draft — pending owner review
Spodick sign
A downsloping TP segment in pericarditis
A gentle downward slope of the TP segment, from the end of the T wave to the next P wave, seen in many patients with acute pericarditis. It helps separate pericarditis from occlusion MI and early repolarization.
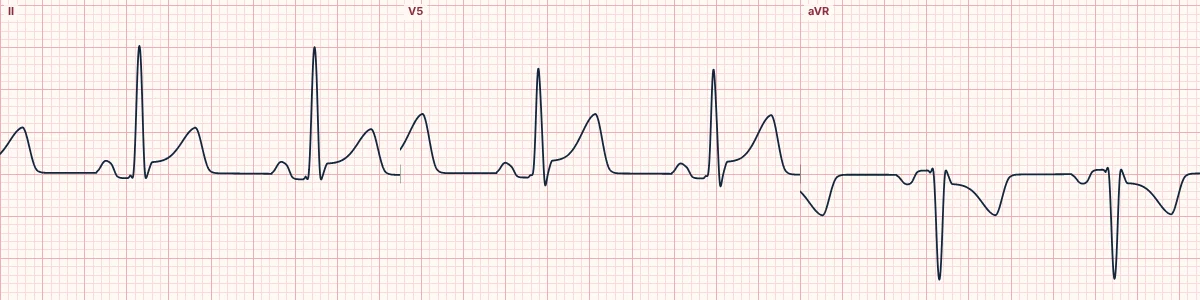
The sign
Between beats, the baseline from the end of the T wave to the start of the next P wave is normally flat. In acute pericarditis it often slopes down, best seen in lead II and the lateral chest leads. It needs a heart rate slow enough to leave a TP segment.
Why it happens
Inflamed atrial epicardium shifts the baseline (the same atrial injury current that depresses the PR segment) while inflamed ventricular epicardium lifts the ST segment. Between the two, the TP segment slopes downward.
Using it
With diffuse concave ST elevation, PR depression and PR elevation in aVR, a downsloping TP segment supports pericarditis. It does not exclude occlusion MI, which can coexist; look for reciprocal ST depression outside aVR and V1.
About the demonstration
The tracing shows acute pericarditis with diffuse ST elevation and PR depression. The TP slope is subtle in the simulation; pause and follow the baseline after each T wave.
How to read it
- Follow the baseline from the end of each T wave to the next P wave.
- When the TP segment slopes, measure ST and PR deviation against the PR segment instead.
- Look for the other features of pericarditis before calling it.
Pitfalls
- Tachycardia hides the TP segment.
- Baseline wander from breathing imitates the slope; check several beats.
Frequently asked questions
Spodick sign: what is the key idea?
A gentle downward slope of the TP segment, from the end of the T wave to the next P wave, seen in many patients with acute pericarditis. It helps separate pericarditis from occlusion MI and early repolarization.
Spodick sign: what are the key numbers?
Best leads: II and V4–V6; Needs: A rate slow enough to show a TP segment; Companions: Diffuse ST elevation, PR depression, PR elevation in aVR.
Spodick sign: how do you apply it to an ECG?
Follow the baseline from the end of each T wave to the next P wave. When the TP segment slopes, measure ST and PR deviation against the PR segment instead. Look for the other features of pericarditis before calling it.
Spodick sign: what are the common pitfalls?
Tachycardia hides the TP segment. Baseline wander from breathing imitates the slope; check several beats.