
Chamber enlargement
Left atrial enlargement
An enlarged left atrium takes longer to depolarize, so the P wave becomes wide and notched in lead II, with a deep negative tail in V1.
Last updated
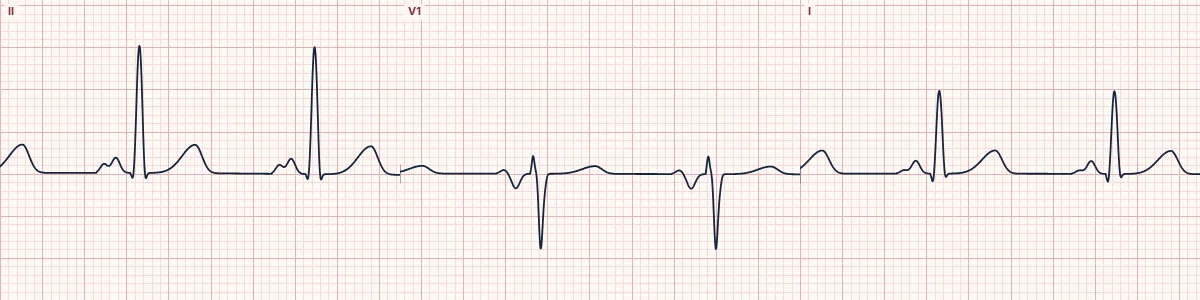
Example tracing, drawn by the lab's engine. Open the lab for a live, adjustable version.
At a glance
- P wave in II
- ≥ 120 ms wide, notched ('M' shaped)
- Notch
- Peaks ≥ 40 ms apart
- P wave in V1
- Terminal negative part ≥ 1 mm deep and ≥ 40 ms wide
- P amplitude
- Normal (≤ 2.5 mm)
Figures
Still images drawn by the lab's engine at 25 mm/s and 10 mm/mV, with the finding labeled. Select a figure to enlarge it.
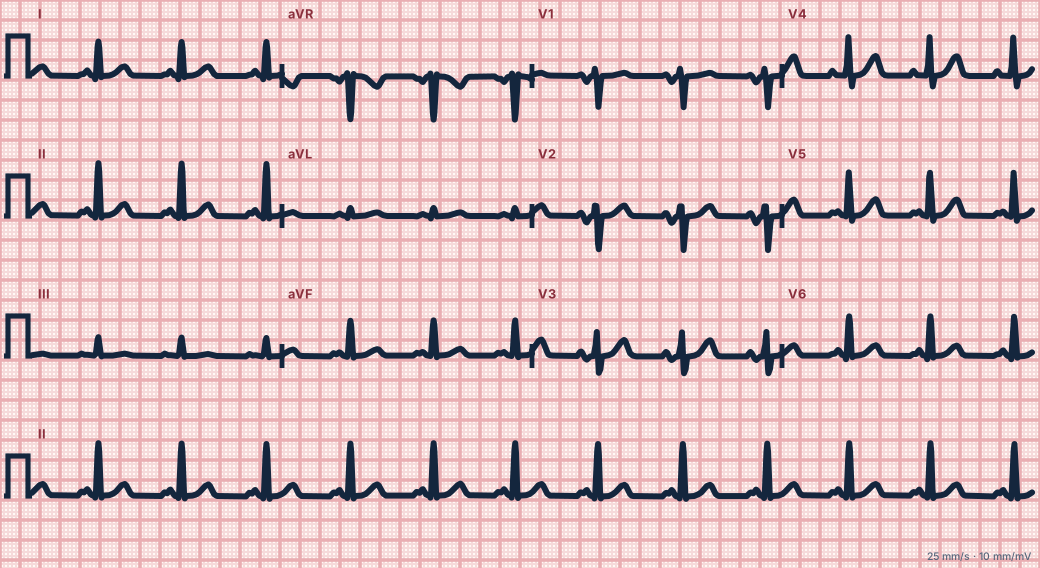
Scroll sideways to see the whole tracing, or select it to enlarge.
What the heart is doing
The right atrium depolarizes first, the left atrium second. A larger left atrium prolongs and enlarges the second component, which points leftward and backward, away from V1.
Why it looks this way
This is left atrial enlargement because the P wave in II is at least 120 ms wide and notched, with a deep terminal negative deflection in V1.
Why it matters
Suggests raised left-sided filling pressures and predicts atrial fibrillation. It is a clue to underlying valve or hypertensive disease and is not treated directly.
What to look for
- In II, the P wave is three small boxes wide or more, with two humps.
- In V1, the second half of the P wave dips at least one small box deep and wide.
- The QRS and PR can be entirely normal.
Criteria
- P wave in II
- ≥ 120 ms wide, notched ('M' shaped)
- Notch
- Peaks ≥ 40 ms apart
- P wave in V1
- Terminal negative part ≥ 1 mm deep and ≥ 40 ms wide
- P amplitude
- Normal (≤ 2.5 mm)
Causes
- Mitral stenosis or regurgitation
- Hypertension and left ventricular hypertrophy
- Aortic stenosis
- Heart failure
- Hypertrophic cardiomyopathy
Can be mistaken for
- Interatrial conduction delay — the same wide P wave with a normal-sized atrium
- Ectopic atrial rhythm — abnormal P axis, not just a wide P wave Compare
- Right atrial enlargement — tall, narrow, peaked P waves Compare
Advanced Down to the ion channel
What the cells are doing
Pacemaker, atrial and ventricular action potentials, in step with the tracing above, with sodium, calcium and potassium moving through their channels.
Frequently asked questions
What are the ECG criteria for left atrial enlargement?
P wave in II: ≥ 120 ms wide, notched ('M' shaped). Notch: peaks ≥ 40 ms apart. P wave in V1: terminal negative part ≥ 1 mm deep and ≥ 40 ms wide. P amplitude: normal (≤ 2.5 mm).
How is left atrial enlargement identified on an ECG?
This is left atrial enlargement because the P wave in II is at least 120 ms wide and notched, with a deep terminal negative deflection in V1.
What can left atrial enlargement be mistaken for?
Interatrial conduction delay: the same wide P wave with a normal-sized atrium. Ectopic atrial rhythm: abnormal P axis, not just a wide P wave. Right atrial enlargement: tall, narrow, peaked P waves.
What causes left atrial enlargement?
Common causes: mitral stenosis or regurgitation; hypertension and left ventricular hypertrophy; aortic stenosis; heart failure; and hypertrophic cardiomyopathy.
Sources
This page does not list page-specific sources yet.
Every source the site cites, with links