
Chamber enlargement
Right ventricular hypertrophy
Thickened right ventricular muscle shifts the electrical forces to the right and forward, giving right axis deviation and a tall R wave in V1.
Last updated
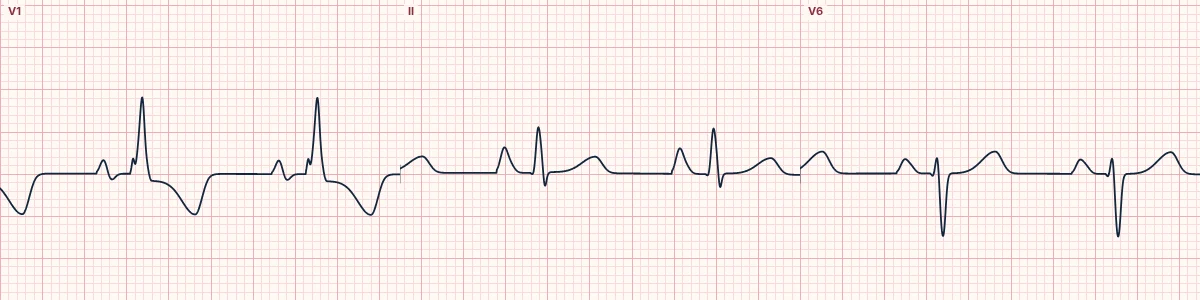
Example tracing, drawn by the lab's engine. Open the lab for a live, adjustable version.
At a glance
- Axis
- Right axis deviation (≥ +110°)
- V1
- Dominant R wave (R larger than S, R ≥ 7 mm)
- V5–V6
- Deep S waves
- ST–T (strain)
- ST depression and T inversion in V1–V3
Figures
Still images drawn by the lab's engine at 25 mm/s and 10 mm/mV, with the finding labeled. Select a figure to enlarge it.
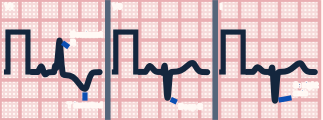
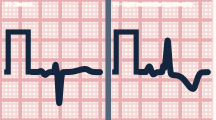
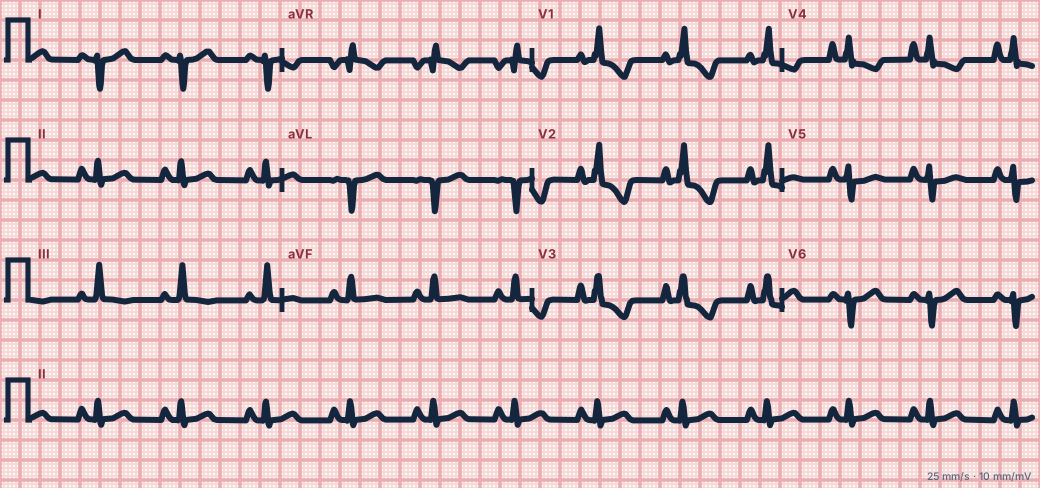
Scroll sideways to see the whole tracing, or select it to enlarge.
What the heart is doing
The enlarged right ventricle contributes enough force to rival the left, swinging the mean QRS vector rightward and anteriorly. Strained right ventricular muscle repolarizes abnormally.
Why it looks this way
This is RVH because there is right axis deviation with a dominant R wave in V1, deep S waves in V5–V6 and right precordial strain.
Why it matters
Points to chronic pressure overload of the right heart; the cause matters more than the ECG. These patients tolerate hypoxia, fluid shifts and positive-pressure ventilation poorly.
What to look for
- Lead I is mainly negative and aVF positive: right axis deviation.
- V1 has an R wave taller than its S wave, the reverse of normal.
- Look for tall peaked P waves in II from right atrial enlargement.
Criteria
- Axis
- Right axis deviation (≥ +110°)
- V1
- Dominant R wave (R larger than S, R ≥ 7 mm)
- V5–V6
- Deep S waves
- ST–T (strain)
- ST depression and T inversion in V1–V3
- QRS
- < 120 ms
Causes
- Pulmonary hypertension
- Chronic lung disease (cor pulmonale)
- Chronic thromboembolic disease
- Mitral stenosis
- Congenital heart disease (pulmonary stenosis, tetralogy of Fallot)
Can be mistaken for
- Posterior infarction — tall R in V1 with ST depression and a normal axis Compare
- RBBB — rsR′ in V1 with QRS 120 ms or more Compare
- WPW type A — short PR and delta wave Compare
Advanced Down to the ion channel
What the cells are doing
Pacemaker, atrial and ventricular action potentials, in step with the tracing above, with sodium, calcium and potassium moving through their channels.
Frequently asked questions
What are the ECG criteria for right ventricular hypertrophy?
Axis: right axis deviation (≥ +110°). V1: dominant R wave (R larger than S, R ≥ 7 mm). V5–V6: deep S waves. ST–T (strain): ST depression and T inversion in V1–V3. QRS: < 120 ms.
How is right ventricular hypertrophy identified on an ECG?
This is RVH because there is right axis deviation with a dominant R wave in V1, deep S waves in V5–V6 and right precordial strain.
What can right ventricular hypertrophy be mistaken for?
Posterior infarction: tall R in V1 with ST depression and a normal axis. RBBB: rsR′ in V1 with QRS 120 ms or more. WPW type A: short PR and delta wave.
What causes right ventricular hypertrophy?
Common causes: pulmonary hypertension; chronic lung disease (cor pulmonale); chronic thromboembolic disease; mitral stenosis; and congenital heart disease (pulmonary stenosis, tetralogy of Fallot).
Sources
This page does not list page-specific sources yet.
Every source the site cites, with links