
The waves
Pathological Q waves
The scar of an old infarction
Dead muscle produces no electrical activity, so leads over a scar look straight through it and record the opposite wall moving away: a wide or deep Q wave.
Last updated
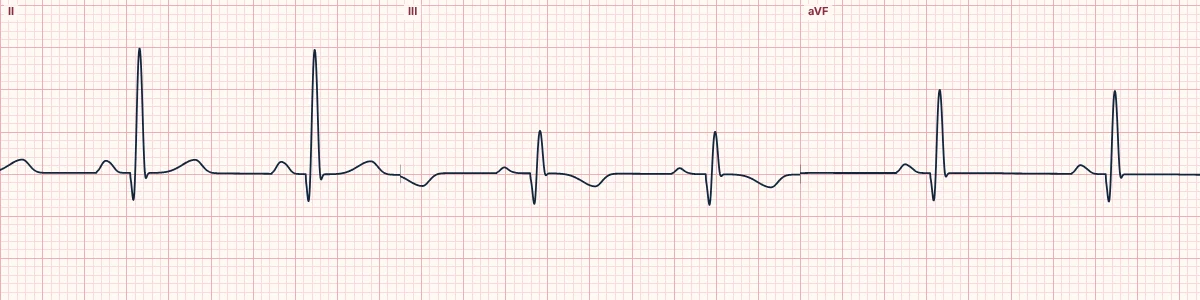
Example tracing, drawn by the lab's engine. Open the lab for a live, adjustable version.
At a glance
- V2–V3
- Any Q ≥ 20 ms, or QS
- Other leads
- Q ≥ 30 ms and ≥ 1 mm, in 2 contiguous leads
- Rule of thumb
- > 40 ms or > 25% of R
Figures
Still images drawn by the lab's engine at 25 mm/s and 10 mm/mV, with the finding labeled. Select a figure to enlarge it.
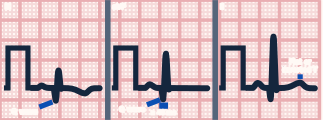
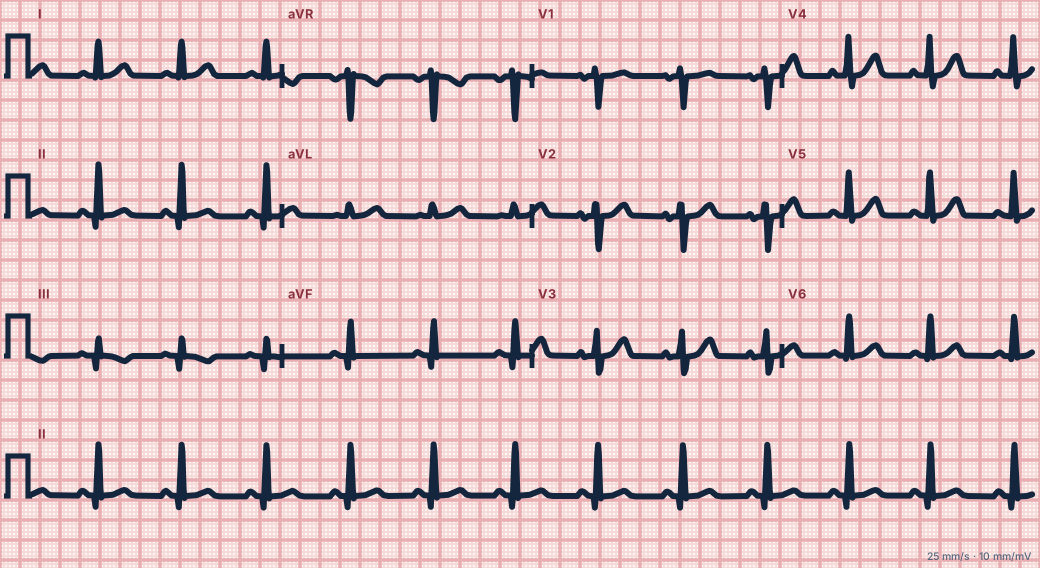
Scroll sideways to see the whole tracing, or select it to enlarge.
When a Q wave is abnormal
Any Q wave in V2 or V3 lasting 20 ms or more (or a QS complex), or a Q wave of 30 ms or more and at least 1 mm deep in two contiguous leads elsewhere, is consistent with prior infarction. An older rule of thumb is a Q wave over 40 ms wide or more than a quarter of the R wave's height.
Normal Q waves
Small septal q waves in I, aVL, V5 and V6 are normal. An isolated Q wave in III that disappears with deep inspiration is usually positional.
Other causes
Hypertrophic cardiomyopathy (narrow, deep septal Q waves), pre-excitation, left bundle branch block, lead misplacement and infiltrative disease can all produce Q waves without infarction.
How to read it
- Group Q waves by territory.
- Compare with old ECGs to date them.
- Persistent ST elevation with Q waves weeks after an infarct suggests a ventricular aneurysm.
Pitfalls
- A QS in V1 alone is common and normal.
Key numbers
- V2–V3
- Any Q ≥ 20 ms, or QS
- Other leads
- Q ≥ 30 ms and ≥ 1 mm, in 2 contiguous leads
- Rule of thumb
- > 40 ms or > 25% of R
Advanced Down to the ion channel
What the cells are doing
Pacemaker, atrial and ventricular action potentials, in step with the tracing above, with sodium, calcium and potassium moving through their channels.
Frequently asked questions
Pathological Q waves: what is the key idea?
Dead muscle produces no electrical activity, so leads over a scar look straight through it and record the opposite wall moving away: a wide or deep Q wave.
Pathological Q waves: what are the key numbers?
V2–V3: Any Q ≥ 20 ms, or QS; Other leads: Q ≥ 30 ms and ≥ 1 mm, in 2 contiguous leads; Rule of thumb: > 40 ms or > 25% of R.
Pathological Q waves: how do you apply it to an ECG?
Group Q waves by territory. Compare with old ECGs to date them. Persistent ST elevation with Q waves weeks after an infarct suggests a ventricular aneurysm.
Pathological Q waves: what are the common pitfalls?
A QS in V1 alone is common and normal.
Sources
This page does not list page-specific sources yet.
Every source the site cites, with links