
Ischemia & prior infarction
Subendocardial ischemia (diffuse ST depression)
Ischemia confined to the inner layer of the ventricle: horizontal or downsloping ST depression, deepest in V4–V6 and the inferior leads, with elevation only in aVR. It does not point to the culprit artery.
Last updated
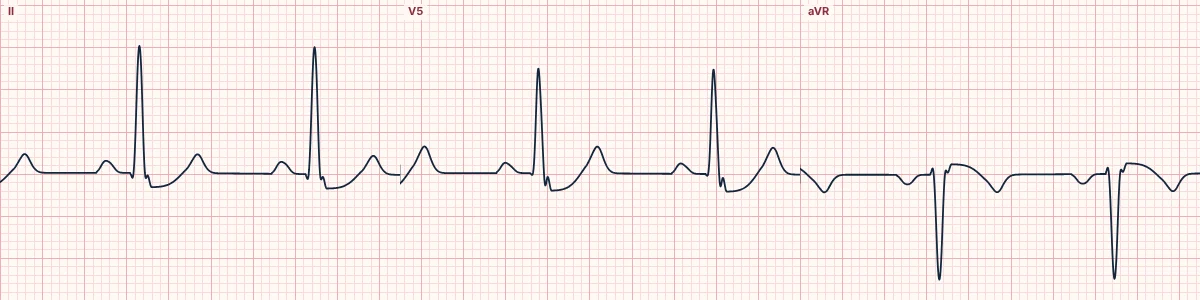
Example tracing, drawn by the lab's engine. Open the lab for a live, adjustable version.
At a glance
- ST depression
- ≥ 0.5–1 mm, horizontal or downsloping
- Distribution
- Widespread: V4–V6, II, aVF and I
- aVR
- Reciprocal ST elevation, usually under 1 mm
- T waves
- Upright, flattened or inverted
Figures
Still images drawn by the lab's engine at 25 mm/s and 10 mm/mV, with the finding labeled. Select a figure to enlarge it.
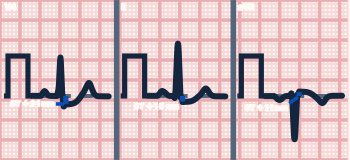
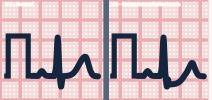
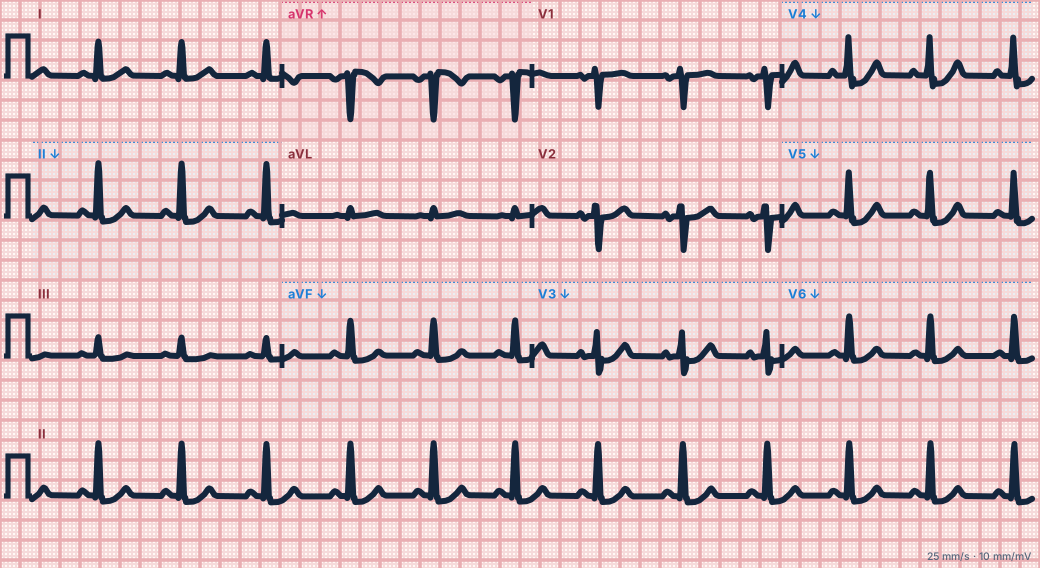
Scroll sideways to see the whole tracing, or select it to enlarge.
What the heart is doing
When only the subendocardium is ischemic, the injury current flows toward the inner wall and away from the surface electrodes. The ST segment is pulled down in most leads and up in aVR, which looks into the cavity.
Why it looks this way
This is subendocardial ischemia because horizontal ST depression appears across V4–V6 and the inferior leads, with reciprocal elevation only in aVR.
Why it matters
Dynamic ST depression during symptoms marks a high-risk acute coronary syndrome or demand ischemia. Unlike ST elevation, where it appears says little about which artery is involved. Treat the cause, repeat the ECG and look for a hidden posterior occlusion.
What to look for
- Measure at the J point and 60–80 ms later: horizontal or downsloping depression matters most.
- Look at aVR: a little elevation there mirrors the widespread depression.
- Compare with a pain-free tracing: change over time is the key finding.
Criteria
- ST depression
- ≥ 0.5–1 mm, horizontal or downsloping
- Distribution
- Widespread: V4–V6, II, aVF and I
- aVR
- Reciprocal ST elevation, usually under 1 mm
- T waves
- Upright, flattened or inverted
- Context
- During pain, tachycardia, anemia or low blood pressure
Causes
- Demand ischemia (tachycardia, anemia, hypotension, hypoxia)
- Severe multivessel or left main disease
- Acute coronary syndrome without occlusion
- Aortic stenosis or severe hypertrophy
Can be mistaken for
- Posterior infarction — ST depression maximal in V1–V3 with upright T waves Compare
- Digoxin effect — scooped, sagging ST depression Compare
- Left ventricular hypertrophy with strain — asymmetric depression and T inversion in tall-R leads Compare
Advanced Down to the ion channel
What the cells are doing
Pacemaker, atrial and ventricular action potentials, in step with the tracing above, with sodium, calcium and potassium moving through their channels.
Frequently asked questions
What are the ECG criteria for subendocardial ischemia (diffuse ST depression)?
ST depression: ≥ 0.5–1 mm, horizontal or downsloping. Distribution: widespread: V4–V6, II, aVF and I. aVR: reciprocal ST elevation, usually under 1 mm. T waves: upright, flattened or inverted. Context: during pain, tachycardia, anemia or low blood pressure.
How is subendocardial ischemia (diffuse ST depression) identified on an ECG?
This is subendocardial ischemia because horizontal ST depression appears across V4–V6 and the inferior leads, with reciprocal elevation only in aVR.
What can subendocardial ischemia (diffuse ST depression) be mistaken for?
Posterior infarction: ST depression maximal in V1–V3 with upright T waves. Digoxin effect: scooped, sagging ST depression. Left ventricular hypertrophy with strain: asymmetric depression and T inversion in tall-R leads.
What causes subendocardial ischemia (diffuse ST depression)?
Common causes: demand ischemia (tachycardia, anemia, hypotension, hypoxia); severe multivessel or left main disease; acute coronary syndrome without occlusion; and aortic stenosis or severe hypertrophy.
Sources
This page does not list page-specific sources yet.
Every source the site cites, with links